收藏切换
Seasonal and inter-annual variations of Arctic cyclones and their linkage with Arctic sea ice and atmospheric teleconnections
收藏切换
PDF
Lixin WEI1, *, Ting QIN1, Cheng LI1, 2
Acta Oceanologica Sinica | 2017, 36(10) : 1 - 7
Less
收藏切换
Acta Oceanologica Sinica | 2017, 36(10): 1-7
Seasonal and inter-annual variations of Arctic cyclones and their linkage with Arctic sea ice and atmospheric teleconnections
Full
Lixin WEI1, *, Ting QIN1, Cheng LI1, 2
Affiliations
  • 1 Key Laboratory of Research on Marine Hazards Forecasting, National Marine Environmental Forecasting Center, State Oceanic Administration, Beijing 100081, China
  • 2 Physical Oceanography Laboratory, Ocean University of China, Qingdao 266100, China
Published: 2017-10-01 doi: 10.1007/s13131-017-1117-9
Outline
收藏切换

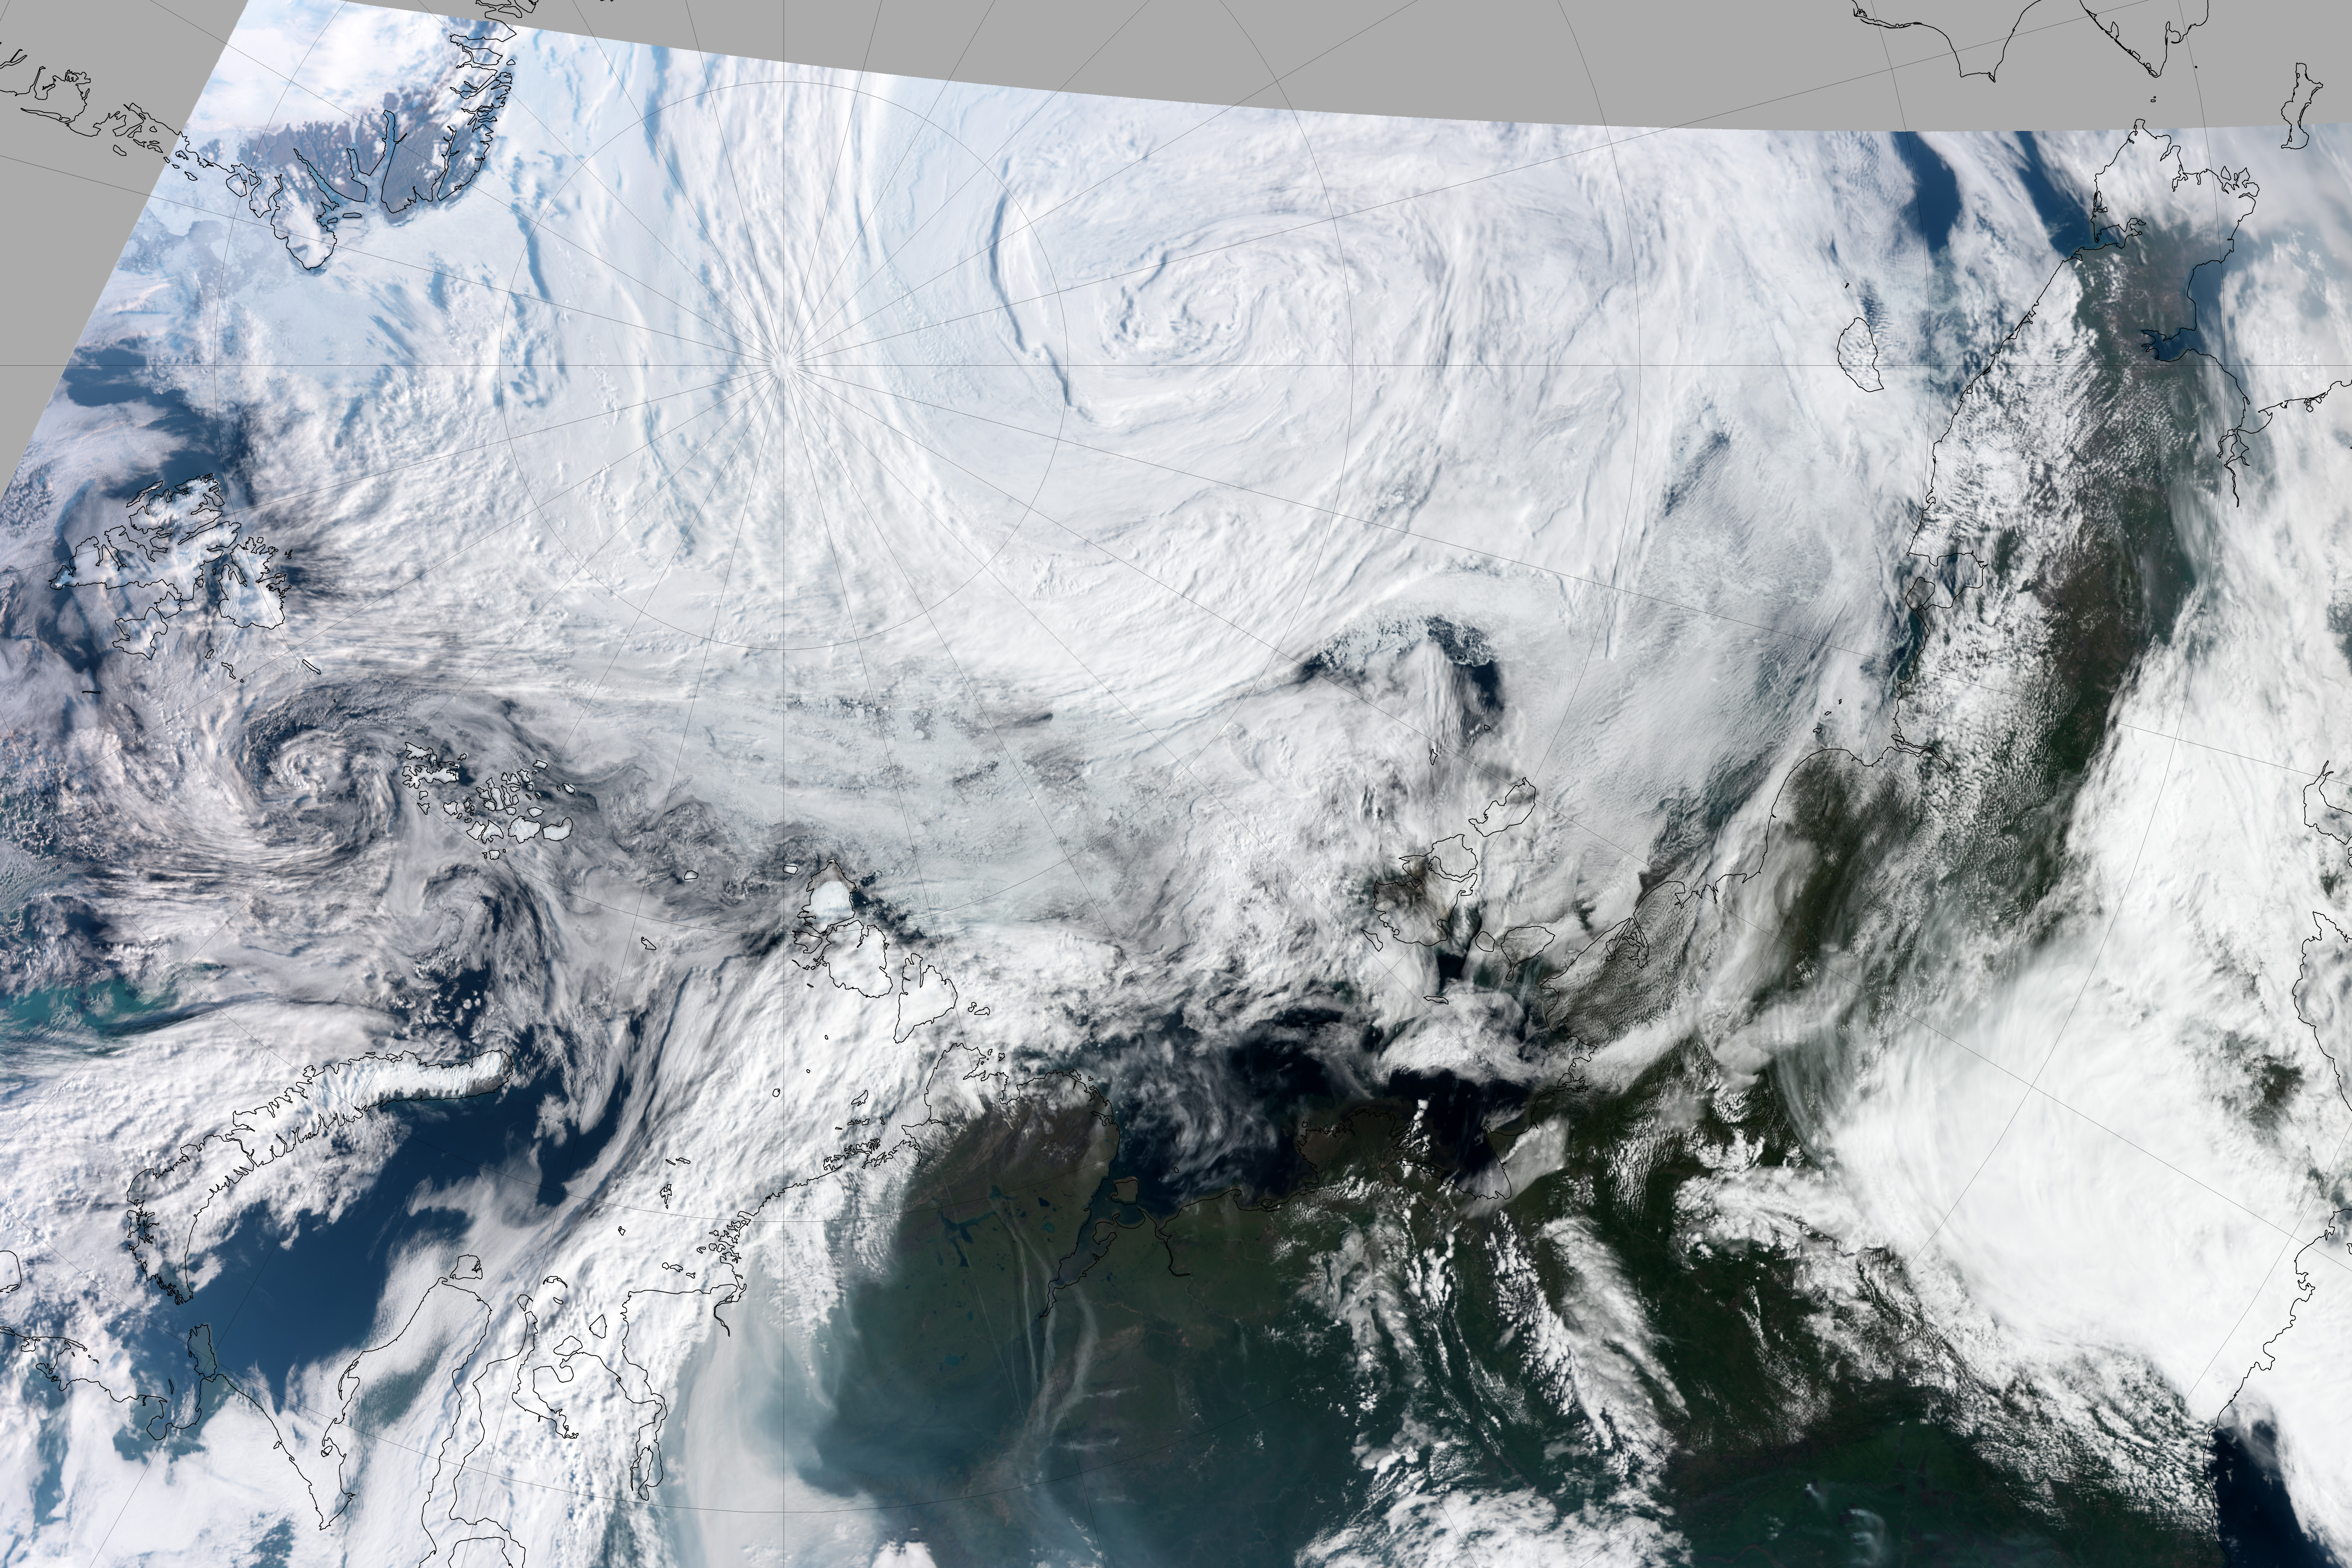
The seasonal and inter-annual variations of Arctic cyclone are investigated. An automatic cyclone tracking algorithm developed by University of Reading was applied on the basis of European Center for Medium-range Weather Forecasts (ECMWF) ERA-interim mean sea level pressure field with 6 h interval for 34 a period. The maximum number of the Arctic cyclones is counted in winter, and the minimum is in spring not in summer. About 50% of Arctic cyclones in summer generated from south of 70°N, moving into the Arctic. The number of Arctic cyclones has large inter-annual and seasonal variabilities, but no significant linear trend is detected for the period 1979–2012. The spatial distribution and linear trends of the Arctic cyclones track density show that the cyclone activity extent is the widest in summer with significant increasing trend in CRU (central Russia) subregion, and the largest track density is in winter with decreasing trend in the same subregion. The linear regressions between the cyclone track density and large-scale indices for the same period and pre-period sea ice area indices show that Arctic cyclone activities are closely linked to large-scale atmospheric circulations, such as Arctic Oscillation (AO), North Atlantic Oscillation (NAO) and Pacific-North American Pattern (PNA). Moreover, the pre-period sea ice area is significantly associated with the cyclone activities in some regions.

Arctic cyclones  /  automated detection and tracking algorithm  /  large-scale climate indices  /  sea ice area index  /  regression analysis
Lixin WEI, Ting QIN, Cheng LI. Seasonal and inter-annual variations of Arctic cyclones and their linkage with Arctic sea ice and atmospheric teleconnections[J]. Acta Oceanologica Sinica, 2017 , 36 (10) : 1 -7 . DOI: 10.1007/s13131-017-1117-9
Arctic cyclone is the most active atmospheric system in a polar region. Its spatial scale is from several tens kilometer to thousands and lifetime from hours to days. The cyclone activity, following with big gale, liquid or solid precipitation, low visibility and great wave, has big impact on solar radiation on the surface, heat and moisture flux transportation in air and ocean, also sea ice deformation and drifting in the Arctic Ocean. Its variability also is an indicator of the climate change at northern high latitude. On August 2012, a strong cyclone went into the central Arctic and lingered there for several days (http://eoimages.gsfc. nasa.gov/images/imagerecords/78000/78808/arctic_vir_2012220_lrg.jpg), causing more attention about the summer cyclone activity and its effect on sea ice melting and drifting.
Owing to the rare in-situ data in polar regions, the widely studies of the Arctic cyclones have started since the 1970s for the achievement of satellite observations, and more information of the cyclone number, distribution and cloud pattern are collected. The use of the automatic cyclone identification and tracking algorithms to reanalysis or modeled data enhanced our ability to better understand the Arctic cyclone climatology. There are mainly two measures to tracking cyclones, one is Eulerian approach, which calculates the variance or covariance of a filtered mean sea level pressure (MSLP) or geopotential height fields which stand for synoptic time scales (about 2.5–8.0 d) (Blackmon, 1976; Ulbrich and Christoph, 1999), the other is Lagrangian measure, tracking cyclonic features from one reanalysis time to the next, e.g., minima in a sea-level pressure or maxima in a relative vorticity (Serreze and Barry, 1988; Serreze, 1995; Zhang et al., 2004; Serreze and Barrett, 2008; Simmonds et al., 2008; Simmonds and Keay, 2009; Simmonds and Rudeva, 2014). A number of studies have focused on the Arctic cyclone activity related to other factors, such as North Atlantic Oscillation (NAO), The Pacific Decadal Oscillation (PDO), El Niño–Southern Oscillation (ENSO), and Pacific–North American Pattern (PNA) (Gulev et al., 2001; Notaro et al., 2006; Wang et al., 2006), sea ice melting and moving (Screen and Simmonds, 2011). In recent years, the GCM simulations are carried out to investigate the variabilty of the Arctic cyclone activity under global warming with different greenhouse gas concentrations (Leckebusch and Ulbrich, 2004; Pinto et al., 2006; Orsolini and Sorteberg, 2009).
In this study, the Reading University automatic tracking scheme (Hodges et al., 1994, 1996) was used to calculate the cyclone trajectories and system density, and a new climatology of cyclones in the Arctic Ocean was presented. The variability of the cyclone activity and its association with the same period large-scale atmospheric mode and pre-period Arctic sea ice area are also examined.
The ECMWF ERA-interim is selected as the primary data. This is a new generation reanalysis data after ERA-40, overlapped in a time period for 1989–2002, but used more complicated assimilation system, many improvement are given. The assimilating model has T255 spectral resolution in the horizontal and 60 levels in the vertical with 6 h temporal resolution. Here, the data cover a 34 a period from 1979 to 2012.
The cyclone tracking scheme derived by Hodges (1994, 1996) University of Reading is used to locate cyclones from the mean sea level pressure of the ERA-interim reanalysis. This scheme identifies the low-pressure system based on the pressure minimum or maximum in the relative vorticity. It has been used to study the climatological activities of an extratropical cyclone in the Northern Hemisphere (e.g., Hoskins and Hodges, 2005; Mesquita et al., 2009), and in the Southern Hemisphere (Uotila et al., 2011; Wei et al., 2016). Note that only those lifetime are not less than 12 h and the minimum central pressure not greater than 1 000 hPa, appearing in the field from 70° to 85°N are counted. A data set is established including a set of parameters for describing cyclone characteristics. In this study, the domain selected is from 70° to 85°N in order to avoid the biases associated with fast cyclones which pass one or more boxes during one time step (Gulev et al., 2001) near the polar point. These biases tend to underestimate storm counts and are mostly pronounced at the high latitude. The seasons are divided for spring (MAM), summer (JJA), autumn (SON) and winter (DJF).
Table 1 provides statistics of the Arctic cyclones during 1979–2012 in each season. The average number has a distinct seasonal cycle, there are the most cyclones in winter, but the least in spring not in summer, however this is not always true for each year. The total number has great interannual variations, the maximum number can reach two times of the minimum in spring or summer. The cyclone intensity (based on the averaged minimum sea level pressure of the cyclone center) does also have an obvious seasonal variation, it is much weaker in summer as compared with the other three seasons. The percentage of intense cyclones (the central pressure less than 980 hPa) in each season indicates weak cyclones in summer, as only 6.4%. But in spring, autumn and winter, the percentages of intense cyclones are 11.8%, 16.0% and 17.4%, respectively.
Statistics show that the percentages of seasonal cyclones crossing 70°N are 46.7%, 50.4%, 39.0% and 37.2% from spring to winter, respectively. The percentage of the cyclones generated from south of 70°N in summer is the highest of the four seasons, which is very close to the results of Sorteberg and Walsh (2008). The crossing cyclones account up 50% of the total cyclone occurrence at north of 70°N, the activities of them are a key factor affecting the Arctic weather, climate and air-sea-ice interaction. As to an explosive event, which is defined as the pressure deepened not less than 12 hPa in 12 h interval, a big gap is observed in each season. There are only 18 explosive cyclones were tracked during 34 summers from 1979 to 2012, with the maximum deepening rate of 18.2 hPa/(12 h). In contrast, the number in winter is 490, with the maximum deepening rate of 24.9 hPa/(12 h).
We divided the study domain into five regions (Fig. 1) following Julienne et al. (2011) .The regions are CHU (Chukchi and East Siberian Seas), CRU (central Russia), GNB (Greenland, Norwegian and Barents Seas), GRL (Greenland) and HNA (high-latitude North American).
Figure 2 presents the cyclone activities in the five subregions respectively. It appears that the percentage is the highest in the CRU reaching 41%, 40%, 40% and 35% from spring to winter, respectively, then the GNB subregion is the second, the percentage reaches 30% in spring and winter, but with a relatively lower percentage, 18%, in summer. The percentage in the HNA is relatively even from 14% to 19%. The maximum percentage of the summer cyclones in the CRU can reach 39%, more active than the other subregions. As to the cyclone crossing into the Arctic Ocean, the percentage varies with season, the top three subregions are the GNB, the CRU and the HNA, respectively, more than 34% crossing cyclones go into the GNB in spring, autumn and winter, but a relatively lower percentage 21%, in summer, relative to the top 37% crossing the CRU in summer.
Figure 3 shows the spatial distribution of the cyclone track density for each season. Here the cyclone density is defined as the occurrences of the cyclones traversing a specified area each season. The scheme is applied to calculating the cyclone density via the Kernel probability density (a nonparametric estimation method), which generates a continuous, smooth cyclone density distribution (the unit is cyclone number per 5°spherical cap area).
As shown in Fig. 3, the high-density can be found in the Norwegian Sea, the Barents Sea, the Kara Sea, but it varies with seasons. In spring, the largest density is located in the Barents Sea and only a few cyclones are tracked in the HNA subregion. The cyclone activity extent is the widest in summer, more cyclones are tracked in the HNA subregion, but the largest density is still in the coast of northern Russia, and the density is much smaller than the other three seasons. In autumn, the high-density moves westward to the Barents Sea and the coastal area of the Kara Sea with larger extent and higher intensity. In winter, both the high-density extent and intensity reach the annual peak. Two centers are detected, one is from the Norwegian Sea to the Barents Sea and the other is in the Baffin Bay
Figure 4 shows the spatial distribution of the linear trend of cyclone track density. The black asterisks denote the linear trend in the areas reaching 95% significant level. In spring, the significant negative trend is detected from the western GNB subregion to most parts of the eastern HNA subregion, which indicates the cyclone decreasing activities. In summer, the significant trends expressed negative in the Norwigian Sea and the Greenland Sea of the GNB subregion and the center Arctic, and clear positive in the Barents Sea of the HNA subregion. Only the CRU subregion has the pronounced negative trend in winter . As to the autumn, there are only some scatter significant areas. In the 33 a study period, the cyclone activities truly have the significant trend in the subregions, these changes also have linkage with atmosphere circulation.
The extratropical cyclone activities are controlled by large-scale atmosphere at the mid- and high-latitudes of the Northern Hemisphere, and also correlated with Arctic sea ice, which is a key factor for the air-sea-ocean interaction of high-latitude, and its extent has been decreasing in all seasons, with the most pronounced loss in September. By regression winter (December, January and February) and summer (June, July and August) anomalies of the cyclone track density from ERA-interim for period 1979–2012 onto the standardized corresponding-period atmospheric index, such as the AO, NAO and PNA, and detrended previous (autumn and spring) Arctic sea ice area index, the linearly congruent between Arctic cyclone activities and the interannual variability of the atmospheric circulation and sea ice area are examined. The large-scale circulation indices (NAO/AO and PNA) are obtained from http://www.esrl.noaa.gov/psd/data/climateindices and a sea ice index is obtained from http://nsidc. org/data/seaice_index. Figures 5a and b give the histograms of normalized large-scale indices and detrended sea ice area index in summer and winter. Here we regressed the seasonal anomalies of the cyclone track density fields onto the same period AO, NAO, PNA indices and pre-period detrended Arctic sea ice area index. The regression coefficient reveals that the cyclones activities are closely linked to the large-scale circulation indices and the sea ice area index. The threshold regression coefficient at 95% confidence level is 0.33.
Figure 6 shows the linear regression of the summer track density with actual AO, NAO, PNA and the detrended spring sea ice area. It reveals that the summer Arctic cyclone activity anomalies are closely linked to the AO and NAO variabilities, and the regression distribution patterns are very similar, but the AO one shows wider area reaching significant level. In Fig. 6a, the significant regression extends from the Denmark Strait and the Greenland Sea, across the central Arctic Ocean to the Baffin Bay and the Canada Basin, which means more cyclones activities in these regions following the anomalously positive AO index. On the opposite, the regions with the negative regression value are only located over the Laptev Sea below significant level. The positive significant regression area is larger in Fig. 6a than that in Fig. 6b. In contrast, the negative correlation areas are larger and deeper in Fig. 6b than in Fig. 6a, especially in the Laptev Sea.
In Fig. 6c, the area of the negative regression between the anomaly track density and the PNA index covers most part of the Arctic Ocean, with the significant area located from north part of Greenland Island, high latitude of North America to the Beaufort Sea, and small part of East Siberian Sea. This means that the anomalously negative PNA is associated with the increased activities of the Arctic cyclones. The PNA impact on the track density is opposite to that of the AO and the NAO in most of the region north of 70°N.
Since the late 1970s, benefited from the satellite observation, the sea ice data in the Arctic have been available for research purpose. The sea ice extent and area have experienced dramatic decreasing, and induced a series variations in local and global climates (Stroeve, 2007; Comiso, 2008). In order to get knowledge about the relationship between the cyclone activities and the sea ice interannual variability, the linear regression between the anomaly summer cyclone activities and the standardized detrended spring sea ice area was carried out. An independent linear regression pattern from that of AO, NAO and PNA was revealed, some significant differences are noticed. In Fig. 6d, it reveals that following anomalously low ice coverage in spring, the summer cyclone activities over the Barents Sea and the Kara sea increased substantially, in north of the Greenland sea, it shows the opposite regression relationship.
Figure 7 shows the regression map between the cyclone winter track density and the actual AO,NAO,PDA, detrended autumn sea ice area. The sign of regression value is opposite to the corresponding maps in Figs 6a and b. Following the positive AO/NAO index, the cyclone activities in the Greenland Sea and the Baffin Bay decreased, and the significant extent is larger for the NAO than the AO. In Fig. 7c, it reveals that the linear correlation between the winter cyclone track density and the PNA is much lower than that in summer. On the contrary, in Fig. 7d, the autumn sea ice has more closely linked to the winter cyclone activities, following sea ice decreasing in autumn, the cyclone track density anomaly is positive in north of the Greenland Sea, and negative in the Barents Sea and east part of the Kara Sea. To a large extent, this pattern is opposite to that of the summer track density with spring sea ice area.
In this study, the information of the Arctic cyclones is obtained by a particular cyclone automatic identification and tracking scheme, which is applied to the ERA-interim reanalysis for the sea level pressure during the period 1979–2012. The criteria of this study is confined on the cyclones lifetime not being less than 12 h, the centre pressure not being greater than 1 000 hPa and the domain from 70° to 85°N. Seasonal and interannual variations of the Arctic cyclone are calculated.
Our results show that the number of the cyclones in the Arctic has strong seasonal variations, the maximum is in winter and the minimum is in spring not in summer, because more cyclones generated from south of 70°N across into the Arctic Ocean through the CRU in summer. The time series of cyclone counts in the four seasons also show large interannual variations and have different linear trends, but none of them reach the significant level (figures omitted).
The cyclone activities highly associate with large-scale atmospheric indices, but this association varies with season, the AO is the most important large-scale circulation indicator that closely links to the Arctic cyclone activities in summer with the positive correlation, but this link is reversed with much shrunk extent in winter. Moreover, the distribution patterns of the cyclone track density regressed on the AO and the NAO are very similar, reflecting the close physical relationship between them. The PNA is also an important large-scale tele-connection pattern affecting the cyclone activities in the Arctic. To highlight this, Notaro (2006) pointed out that the Atlantic cyclone activity maximum over Newfoundland is dominantly influenced by the PNA pattern. Here, we found that the PNA has mostly the opposite impact on cyclones compared with the AO,NAO, particularly over the CHU and HNA regions in summer.
For the past a few years, the Arctic sea ice has been experiencing accelerated decline in all season. The replacement of highly reflective sea ice by open water increases the ocean surface flux of heat and moisture into the atmosphere, which in turn has substantial impacts on the winter atmospheric circulation. In this study, we also examined the linearly links between the cyclone track density and the interannual variability of the preseason Arctic sea ice area. The regression map reveals that the cyclone track density in the Arctic Ocean is closely linked to the Arctic sea ice variability, the pattern linked to the reduction of Spring,Autumn sea ice shows clearly different interannual variability relative to the classical winter AO,NAO pattern.
This study shows that the complexity of the Arctic cyclone activity, it controlled by several factors, none of the patterns (AO,NAO, PNA, sea ice) alone sufficiently explains the variabilities of cyclone counts and activities. This indicates that to obtain an overall view on the Arctic cyclone activity, all relevant patterns need to be considered. And the relationships between these factors and cyclones may change with time, as pointed out by Gulev et al. (2001).
  • The Chinese Polar Environment Comprehensive Investigation and Assessment Programmes under contract No. 2016-04-03; the National Key Research and Development Program of China under contract No. 2016YFC1402701.
Blackmon M L. 1976. A climatological spectral study of the 500 mb geopotential height of the Northern Hemisphere. Journal of the Atmospheric Sciences, 33(8): 1607–1623
Comiso J C, Parkinson C L, Gersten R, et al,. 2008. Accelerated decline in the arctic sea ice cover. Geophysical Research Letters, 35(1): 179–210
Gulev S K, Zolina O, Grigoriev S. 2001. Extratropical cyclone variability in the Northern Hemisphere winter from NCEP/NCAR reanalysis data. Climate Dynamics, 17(10): 795–809
Hodges K I. 1994. A general method for tracking analysis and its application to meteorological data. Monthly Weather Review, 122(11): 2573–2586
Hodges K I. 1996. Spherical nonparametric estimators applied to the UGAMP model integration for AMIP. Monthly Weather Review, 124(12): 2914–2932
Hoskins B J,Hodges K I. 2005. A new perspective on the Southern Hemisphere winter storm tracks. Journal of Climate, 18(20): 4108–4129
Julienne C S, Mark C S, Andrew B, et al. 2011. Attribution of recent changes in autumn cyclone associated precipitation in the Arctic. Tellus A, 63:10.1111/tea.2011.63. issue-4: 653–663
Leckebusch G C, Ulbrich U. 2004. On the relationship between cyclones and extreme windstorm events over Europe under climate change. Global & Planetary Change, 44(1): 181–193
Mesquita M D, Hodges K I, Atkinson D E, et al. 2009. Sea-ice Changes in the Sea of Okhotsk: Relationship with Northern Hemisphere Storm Tracks. San Francisco, CA: American Geophysical Union, Fall Meeting 2009 Abstract.
Notaro M, Wang W C, Gong, W. 2006. Model and observational analysis of the northeast US regional climate and its relationship to the PNA and NAO patterns during early winter.Monthly Weather Review, 134: 3479–3505
Orsolini Y J, Sorteberg A. 2009. Projected changes in Eurasian and Arctic summer cyclones under global warming in the Bergen climate model. Atmospheric and Oceanic Science Letters, 2(1): 62–67
Pinto J G, Spangehl T, Ulbrich U, et al. 2006. Assessment of winter cyclone activity in a transient ECHAM4-OPYC3 GHG experiment. Meteorologische Zeitschrift, 15(3): 279–291
Serreze M C. 1995. Climatological aspects of cyclone development and decay in the arctic. Atmosphere-Ocean, 33(1): 1–23
Serreze M C, Barrett A P. 2008. The summer cyclone maximum over the central Arctic Ocean. Atmosphere-Ocean, 33(1): 1–23
Serreze M C, Barry R G. 1988. Synoptic activity in the Arctic Basin, 1979-1985. Journal of Climate, 1: 1276–1295
Screen J A, Simmonds I. 2011. Erroneous Arctic temperature trends in the ERA-40 reanalysis: a closer look. Journal of Climate, 24(10): 2620–2627
Simmonds I, Burke C, Keay K. 2008. Arctic climate change as manifest in cyclone behavior. Journal of Climate, 21(22): 5777–5796
Simmonds I, Keay K. 2009. Extraordinary September Arctic sea ice reductions and their relationships with storm behavior over 1979–2008. Geophysical Research Letters, 36(19): 158–168
Simmonds I, Rudeva I. 2014. A comparison of tracking methods for extreme cyclones in the Arctic Basin. Tellus A,66,25252
Sorteberg A, Walsh J E. 2008. Seasonal cyclone variability at 70°N and its impact on moisture transport into the Arctic. Tellus, 60A: 570–586
Stroeve J, Holland M M, Meier W, et al. 2007. Arctic sea ice decline: faster than forecast. Geophysical Research Letters, 34(9): 529–536
Ulbrich U, Christoph M. 1999. A shift of the NAO and increasing storm track activity over Europe due to anthropogenic greenhouse gas forcing. Climate Dynamics, 15(7): 551–559
Uotila P, Vihma T, Pezza A B, et al. 2011. Relationships between Antarctic cyclones and surface conditions as derived from high-resolution numerical weather prediction data. Journal of Geophysical Research: Atmospheres, 116(D7):D07109
Wang X L, Swail V R, Zwiers F W. 2006. Climatology and changes of extratropical cyclone activity: comparison of ERA-40 with NCEP–NCAR reanalysis for 1958–2001. Journal of Climate, 19(13): 3145
Wei L, Qin T. 2016. Characteristics of cyclone climatology and variability in the Southern Ocean. Acta Oceanologica Sinica, 35(7): 59–67
Zhang X, Walsh J E, Zhang J. 2004. Climatology and interannual variability of Arctic cyclone activity: 1948-2002. Journal of Climate, 17: 2300–2317
Year 2017 volume 36 Issue 10
PDF
30
16
Cite this Article
BibTeX
Article Info
doi: 10.1007/s13131-017-1117-9
  • Receive Date:2017-06-27
  • Online Date:2026-04-16
  • Published:2017-10-01
Article Data
Affiliations
History
  • Received:2017-06-27
  • Accepted:2017-08-17
Funding
The Chinese Polar Environment Comprehensive Investigation and Assessment Programmes under contract No. 2016-04-03; the National Key Research and Development Program of China under contract No. 2016YFC1402701.
Affiliations
    1 Key Laboratory of Research on Marine Hazards Forecasting, National Marine Environmental Forecasting Center, State Oceanic Administration, Beijing 100081, China
    2 Physical Oceanography Laboratory, Ocean University of China, Qingdao 266100, China

Corresponding:

References
Share
https://castjournals.cast.org.cn/joweb/aos/EN/10.1007/s13131-017-1117-9
Share to
QR

Scan QR to access full text

Cite this article
BibTeX
Citations
表12种不同金属材料的力学参数

Family
属数
Number of
genus
种数
Number of
species
占总种数比例
Percentage of
total species (%)

Genus
种数
Number of
species
占总种数比例
Percentage of total
species (%)
鹅膏菌科Amanitaceae 2 11 5.26 鹅膏菌属 Amanita 10 4.78
小菇科 Mycenaceae 2 12 5.74 丝盖伞属 Inocybe 5 2.39
多孔菌科 Polyporaceae 8 14 6.70 蜡蘑属 Laccaria 5 2.39
红菇科 Russulaceae 3 23 11.00 小皮伞属 Marasmius 6 2.87
小菇属 Mycena 11 5.26
光柄菇属 Pluteus 5 2.39
红菇属 Russula 17 8.13
栓菌属 Trametes 5 2.39
关闭全屏
  • BibTeX
  • EndNote
  • RefWorks
  • TxT